Most people think stock trading is about guessing where prices will go next. That’s not trading. That’s gambling. Real trading is a science - a mix of data, discipline, and decision-making under uncertainty. If you’re trying to make money in the market without understanding the rules, you’re already behind. The good news? You don’t need to be a math genius or work on Wall Street. You just need to know what to look for - and what to ignore.
What Actually Moves Stock Prices?
Stock prices don’t move because someone said so. They move because of real forces: supply and demand, earnings reports, interest rates, geopolitical events, and - most importantly - what investors believe will happen next. The market is a giant prediction engine. Every trade is a bet on the future. Your job isn’t to predict the future perfectly. It’s to spot where the odds are in your favor.
Take Apple in 2023. Its stock dropped 8% in one day after reporting slower iPhone sales. Not because the company was failing. But because investors had expected 5% growth and got 2%. That gap - between expectation and reality - is what moves prices. Understanding that gap is the first step in making informed decisions.
Two Pillars of Informed Trading: Fundamental and Technical Analysis
You can’t trade without two tools: fundamental analysis and technical analysis. One tells you what a company is worth. The other tells you when to buy or sell it.
Fundamental analysis looks at the business: revenue, profit margins, debt levels, management quality, and industry trends. For example, if a company like NVIDIA has consistent revenue growth above 40% year over year, strong cash flow, and dominates AI chip demand, it’s fundamentally strong. That doesn’t mean the stock won’t drop tomorrow. But over time, strong fundamentals tend to drive prices up.
Technical analysis looks at price patterns and volume. It doesn’t care about earnings. It cares about how people are behaving. If a stock has bounced off the same price level three times in the last six months, that’s a support level. If volume spikes when it breaks above a 200-day moving average, that’s a signal more buyers are stepping in. Traders use charts not to predict the future, but to read the collective mood of the market.
Most successful traders combine both. They use fundamentals to pick stocks that should grow. They use technicals to time their entries and exits. One without the other is like driving with one eye closed.
The Hidden Factor: Trading Psychology
You can have the best strategy in the world. But if fear and greed run your decisions, you’ll lose money. Studies from the University of California show that individual traders who check their portfolios more than once a day are 37% more likely to make impulsive trades and underperform the S&P 500 by an average of 5% annually.
Why? Because emotions hijack logic. When a stock drops 10%, your brain screams, “Sell now!” When it jumps 20%, it whispers, “Buy more!” But the market doesn’t care what you feel. It only responds to data.
The fix? Build rules. Write them down. Stick to them. For example:
- Never risk more than 1% of your account on a single trade.
- If a stock drops 8% below your entry and your thesis hasn’t changed, hold - don’t panic.
- If you’re excited about a trade, wait 24 hours. If you’re still sure, go ahead.
These aren’t magic. They’re armor against your own impulses.
Tools That Actually Help - And the Ones That Don’t
There are hundreds of apps, indicators, and “signals” promising to make you rich. Most are noise. Here’s what works:
- TradingView - for charting, drawing support/resistance levels, and backtesting strategies.
- Yahoo Finance or Finviz - for earnings calendars, financial ratios, and sector performance.
- SEC EDGAR database - for reading actual 10-K and 10-Q filings. Yes, you have to read them. No, a summary won’t cut it.
What doesn’t work?
- Telegram groups selling “guaranteed” buy signals.
- AI tools claiming to predict tomorrow’s price with 90% accuracy.
- Day trading apps that gamify buying stocks like a slot machine.
The market doesn’t reward speed. It rewards accuracy - and patience.
How to Build a Simple Informed Trading Plan
You don’t need a PhD. You need a system. Here’s a basic plan anyone can use:
- Define your goal: Are you building long-term wealth? Or trading for short-term gains? This changes everything.
- Choose your time frame: Swing trading (days to weeks) is easier for beginners than day trading. Position trading (months) is even calmer.
- Select 5-10 stocks based on fundamentals: Look for consistent revenue growth, low debt, and strong free cash flow.
- Set entry and exit rules: Example: Buy if price holds above 50-day moving average and RSI is below 70. Sell if it breaks below 200-day average.
- Track every trade: Write down why you entered, what you expected, and what actually happened. Review weekly.
That’s it. No complex formulas. No secret indicators. Just clarity, discipline, and repetition.
Common Mistakes That Destroy Traders
Here’s what most people get wrong:
- Chasing hot stocks: If everyone’s talking about a stock, it’s usually already priced in. The real money is made in the quiet ones.
- Ignoring position sizing: Losing 20% on one trade because you bet too big can take months to recover from.
- Not having a plan: If you don’t know when to exit, you’ll be stuck in a losing trade forever.
- Trading too often: The average profitable trader makes 1-3 trades a month. The average losing trader makes 15.
One trader I know in Chicago traded only 12 times in 2024. He made 14% returns. Another traded daily. Lost 18%. The difference? One had a plan. The other had a habit.

Where to Find Reliable Data (No Paywalls)
You don’t need expensive subscriptions. Here’s where to get real data for free:
- SEC EDGAR - company filings (10-K, 10-Q, 8-K)
- Yahoo Finance - financials, charts, analyst estimates
- Finviz - stock screener with filters for P/E, dividend yield, market cap
- Investing.com - economic calendar, interest rate trends, commodity prices
- Federal Reserve Economic Data (FRED) - inflation, unemployment, GDP
Use these to answer one question before every trade: “What’s the evidence this move makes sense?” If you can’t answer it, don’t trade.
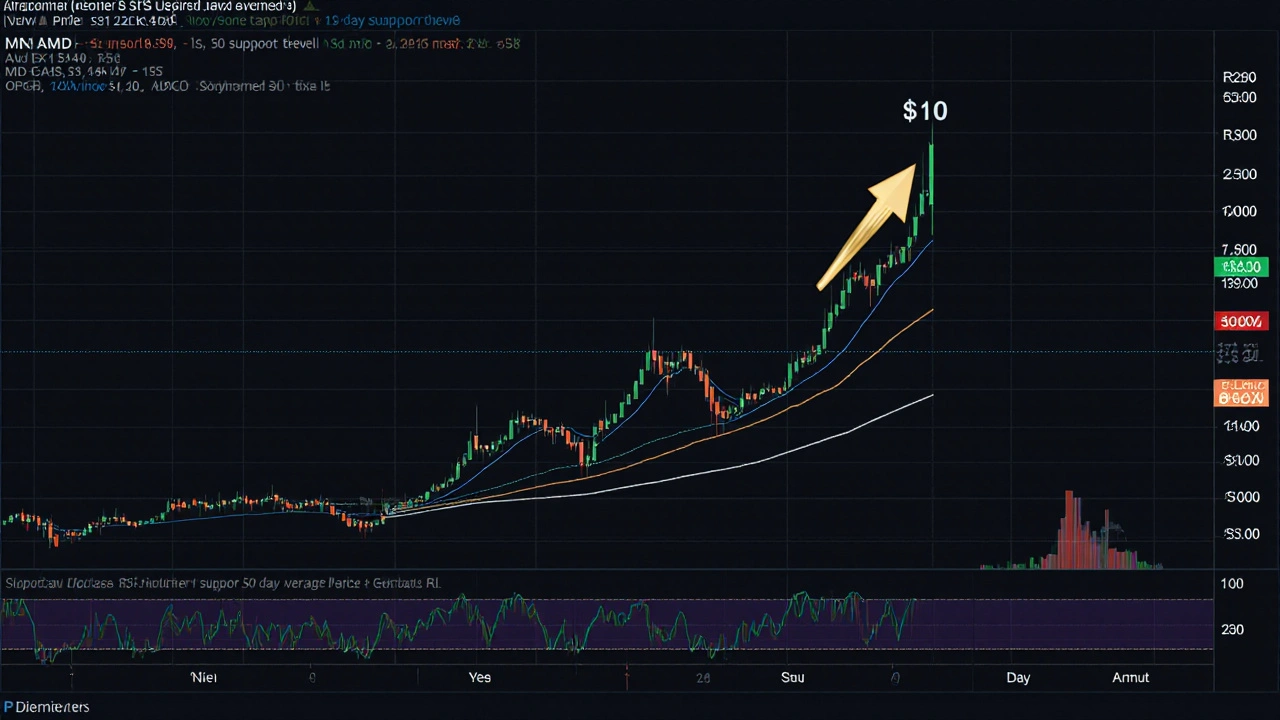
Real Example: How a $10,000 Trade Played Out in 2024
Let’s say you looked at AMD in January 2024. Its stock had fallen 20% from its 52-week high. Why? Investors worried about AI demand slowing.
You checked:
- Revenue growth: +28% YoY
- Operating margin: up from 11% to 18%
- Debt-to-equity: 0.4 - low for tech
- Chart: price had found support at $110 three times in 4 months
- RSI: 38 - not oversold, but not overbought
You bought $10,000 worth at $112. Set a stop-loss at $102 (9% below). Set a target at $140 (25% gain). Three weeks later, earnings beat estimates. The stock jumped to $138. You sold. Profit: $2,500.
You didn’t guess. You analyzed. That’s the science.
Final Thought: Trading Is a Skill, Not a Lottery
The market doesn’t reward luck. It rewards preparation. It doesn’t care if you’re rich or poor, young or old. It only cares if you understand the rules and follow them.
You don’t need to be the smartest person in the room. You just need to be the most consistent. The most patient. The most disciplined.
Start small. Track everything. Learn from every loss. And never, ever trade on emotion.
That’s how you make informed decisions. That’s how you turn stock trading from a gamble into a career.
Is stock trading really a science?
Yes, when done correctly. Stock trading uses data, patterns, and rules to make decisions - not guesses or emotions. Fundamental analysis evaluates company health, technical analysis reads price behavior, and psychology manages risk. Together, they form a repeatable system. The science isn’t in predicting the future - it’s in managing probabilities and controlling your actions.
Can I make money trading without a finance degree?
Absolutely. Many successful traders have no formal finance background. What matters is learning how to read financial statements, understand charts, and control emotions. Free tools like Yahoo Finance, Finviz, and SEC EDGAR give you access to the same data professionals use. The barrier isn’t education - it’s discipline. If you can stick to a plan and learn from mistakes, you can succeed.
What’s the best time frame for beginners to trade?
Swing trading - holding positions for days to weeks - is ideal for beginners. It removes the pressure of minute-by-minute decisions, reduces transaction costs, and gives you time to analyze. Day trading requires constant attention, advanced tools, and emotional control most new traders don’t have. Position trading (months to years) is even better for building wealth, but swing trading strikes the right balance between learning and results.
How much money do I need to start trading?
You can start with as little as $500 on platforms like Robinhood or Webull. But to trade effectively, aim for at least $2,000-$5,000. This lets you diversify across 3-5 stocks and follow the 1% risk rule (never risking more than 1% of your account on a single trade). Starting too small forces you to over-leverage, which increases risk. Capital isn’t about getting rich fast - it’s about staying in the game long enough to learn.
Do I need to use technical indicators like RSI or MACD?
Not necessarily. Many successful traders use only price action and volume. Indicators like RSI or MACD can help confirm trends, but they lag behind price. The most reliable signals come from support/resistance levels, breakout patterns, and volume spikes. Use indicators as filters, not triggers. If your strategy relies on five different indicators, it’s probably too complicated. Simplicity wins.
How do I know if my trading strategy is working?
Track every trade in a journal. After 20-30 trades, look at your win rate and average profit per trade. A strategy with a 40% win rate can still be profitable if your average gain is twice your average loss. That’s called a positive expectancy. If your losses are bigger than your wins, or you’re inconsistent, your strategy needs adjustment - not more effort. Backtest it on historical data before risking real money.
sonny dirgantara
November 16, 2025 AT 22:21bro i just bought a stock because it had a cool logo and now im down 30% lol
Jawaharlal Thota
November 18, 2025 AT 15:19Man, I’ve been where you are. Used to chase meme stocks like they were lottery tickets. Then I started reading 10-Ks like they were novels - slow, painful, but worth it. I didn’t know what EBITDA meant at first. I looked it up every time. Now I check it before I even glance at the chart. It’s not about being smart. It’s about being stubborn enough to learn when everyone else is scrolling TikTok. I started with $800. Made my first real profit after 11 losses. Took me 14 months. But when I finally nailed a trade using fundamentals + technicals? Felt like I’d cracked a code. The market doesn’t care how fast you type. It cares if you show up every day and do the boring stuff. No magic indicators. No guru signals. Just consistency. And yeah, I still check my portfolio too much. But now I have rules. If I feel excited about a trade? I sleep on it. If I’m scared? I check my thesis again. Not my balance. My thesis. That’s the difference between gambling and growing.
Lauren Saunders
November 19, 2025 AT 06:02How quaint. You treat trading like a hobby for middle-class hobbyists. The real market moves on institutional flows, dark pool liquidity, and options flow - none of which are visible on Finviz. Your ‘science’ is just retail wishful thinking dressed up in accounting jargon. You think reading a 10-K makes you an analyst? Please. I’ve seen hedge funds get wrecked by fundamentals that looked ‘perfect.’ The real edge isn’t in data - it’s in access. And sentiment. And timing. Your ‘rules’ are cute. But they’re for people who don’t understand that markets are psychological warfare disguised as finance.
Andrew Nashaat
November 21, 2025 AT 03:41Okay, so let me get this straight: you’re telling people to read 10-Ks… but you didn’t mention that 87% of retail investors who do that still lose money because they don’t understand accrual accounting, deferred revenue, or goodwill impairment? And you’re recommending TradingView? Bro, I’ve seen people draw trendlines on 1-minute charts like they’re predicting the weather. And then you say ‘don’t trade on emotion’ - but you don’t even mention that 92% of emotional trades happen after earnings? And you didn’t even mention short interest or institutional ownership? You’re giving people a Swiss Army knife and calling it a scalpel. And don’t get me started on ‘RSI below 70’ - that’s a trap in a bull market! You’re not teaching trading - you’re teaching confirmation bias with a spreadsheet!
Gina Grub
November 22, 2025 AT 16:56Let’s be real - this whole post is just a PSA for people who want to feel smart without doing the work. You talk about ‘science’ but you ignore behavioral finance. You talk about ‘discipline’ but you don’t mention that the average trader holds a position for 11 days - and loses 8% of their capital doing it. You list tools like Yahoo Finance like they’re holy relics. But you don’t mention that 70% of retail traders use the same indicators, creating self-fulfilling prophecies. And you think a $10k trade with a 25% gain is ‘science’? That’s luck with a checklist. The market doesn’t reward consistency - it rewards those who see what others can’t. Your ‘rules’ are just noise filters for people who can’t handle ambiguity.
Nathan Jimerson
November 23, 2025 AT 17:57Just wanted to say - this post gave me hope. I’ve been scared to start because I thought I needed a finance degree or a million dollars. But reading this made me realize I just need to start small, stay patient, and keep learning. I opened a brokerage account last week with $300. Bought one share of a company I actually use. Not because it’s going to explode - but because I understand what they do. That’s my first step. No rush. No pressure. Just progress. Thanks for the clarity.
Sandy Pan
November 24, 2025 AT 19:18There’s something deeply human about this entire conversation. We treat the market like a machine - a system of inputs and outputs - but it’s not. It’s a mirror. Every trade reflects the collective anxiety, hope, and greed of millions of people trying to make sense of an uncertain world. The ‘science’ you describe? It’s not about predicting prices. It’s about managing your relationship with uncertainty. The real question isn’t ‘How do I make money?’ It’s ‘How do I not destroy myself trying?’ The charts don’t lie - but they don’t tell the whole truth either. The truth is inside you. The rules you write? They’re not for the market. They’re for the part of you that panics when the screen turns red. That’s the real science. Not the numbers. The silence between the trades.
Eric Etienne
November 25, 2025 AT 17:08lol why are we pretending this is rocket science? I’ve met 50 traders. 48 of them are broke. The other two run YouTube channels. You think reading 10-Ks makes you rich? Nah. You think technicals work? They work until they don’t. The only thing that works is being in the right place at the right time. And knowing when to get out before the FOMO crowd shows up. This whole post is just a 10,000-word pep talk for people who want to feel like they’re doing something productive while staring at green and red numbers. Just go get a job.
Dylan Rodriquez
November 26, 2025 AT 01:18There’s so much truth here - and so much pressure. I want to believe in this system. But I’m scared of failing. I’m scared of wasting time. I’m scared of losing money I can’t afford to lose. But I’m more scared of looking back in five years and realizing I never tried. I’ve been reading your post like a manifesto. Not because I think it’s perfect - but because it’s honest. I’m not going to trade tomorrow. But I’m going to open a brokerage account. I’m going to track one trade. I’m going to write down why I did it. And I’m going to come back here in six months and tell you what happened. No grand plans. No get-rich-quick dreams. Just one step. That’s all I need to start.
Amanda Ablan
November 26, 2025 AT 16:03I appreciate how grounded this is. I used to think trading was about being aggressive - buying the dip, riding the wave, going all in. Then I lost $2k on a single ‘sure thing’ because I ignored my own rules. Now I trade maybe once a month. I use your exact framework: fundamentals to pick, technicals to time, psychology to hold. I don’t need to be right every time. I just need to be right enough, and keep my losses small. I’ve made 18% this year with only 7 trades. Not because I’m smart - because I’m patient. And I’m not trying to beat the market. I’m trying to not lose to it.
Meredith Howard
November 26, 2025 AT 20:12Yashwanth Gouravajjula
November 28, 2025 AT 11:11India 2024: 8 million new traders. 95% lose. Same story. Read 10-K. Wait. Don’t rush. Discipline wins.
Kevin Hagerty
November 28, 2025 AT 22:46Oh wow look at this guy who thinks reading a 10-K makes you Warren Buffett. You didn’t even mention that most companies lie in their filings. Or that insider trading is rampant. Or that the SEC is basically a rubber stamp for big corps. You think your ‘rules’ protect you? Nah. You’re just another sucker who thinks the market is fair. You’re not trading. You’re volunteering to be the liquidity provider for hedge funds that front-run your trades. And you’re proud of it? Pathetic.
Janiss McCamish
November 30, 2025 AT 00:47I started with $500. Bought a single stock. Held it for 8 months. Made 40%. Didn’t check it daily. Didn’t use any indicators. Just watched earnings and management tone. That’s it. You don’t need fancy tools. You need patience. And the guts to ignore the noise. If you’re overwhelmed - start with one stock. One rule. One trade. Build from there. No rush. No drama. Just steady.
Andrew Nashaat
December 1, 2025 AT 11:49Wait - you actually think RSI below 70 is a buy signal in a bull market? That’s like saying ‘it’s not raining’ so I’ll go outside without a coat. RSI is a lagging indicator - it’s useless if you’re trying to catch momentum. And you didn’t mention that 80% of breakouts fail within 3 days? Your ‘support levels’ are just psychological illusions created by retail traders looking at the same charts. You’re teaching people to chase their own reflections. And you call this science? This is folk wisdom wrapped in Excel.