Price Action: Understand Market Moves Without Indicators
When you look at a stock chart, what you’re really seeing is price action, the raw movement of an asset’s price over time, without any added indicators or overlays. Also known as raw price movement, it’s how professional traders decide when to buy or sell—without relying on moving averages, RSI, or MACD. It’s not magic. It’s pattern recognition grounded in how real people actually trade.
Price action works because markets are driven by human behavior. When a stock spikes on high volume, it’s not because of a formula—it’s because buyers overwhelmed sellers. When a candlestick closes near its low after a big rally, it’s not random—it’s a signal that momentum is fading. This is why candlestick patterns, visual formations like doji, hammer, or engulfing bars that reveal trader sentiment at key price levels matter. They’re not guesses. They’re records of decisions made by thousands of traders in real time. And when you combine those patterns with support and resistance levels, price zones where buyers or sellers have historically stepped in to defend a level, you start seeing the market’s true rhythm.
Most beginners think they need complex tools to win. But the best traders often use nothing but a price chart. Why? Because indicators lag. They react to what already happened. Price action tells you what’s happening right now. It shows you where big players are entering or exiting. It reveals when a trend is weakening before any oscillator does. That’s why market psychology, the collective mood of traders that drives buying and selling pressure is the hidden engine behind every price move. Fear and greed don’t show up in formulas—they show up in the shape of candles and the width of price ranges.
You won’t find any magic indicators here. What you’ll find are real, battle-tested approaches to reading the market the way pros do. From spotting breakout failures to reading inside bars on a 5-minute chart, the posts below give you the tools to trade with clarity—not confusion. Whether you’re new to charts or you’ve been trading for years but still feel like you’re guessing, these guides cut through the noise. You’ll learn how to spot high-probability setups, manage risk without overcomplicating things, and stop chasing signals that don’t work. This isn’t about predicting the future. It’s about reading what the market is telling you right now—and acting on it with confidence.
Stock Trading: How to Decode Market Trends
- Lorcan Sterling
- 10 Comments
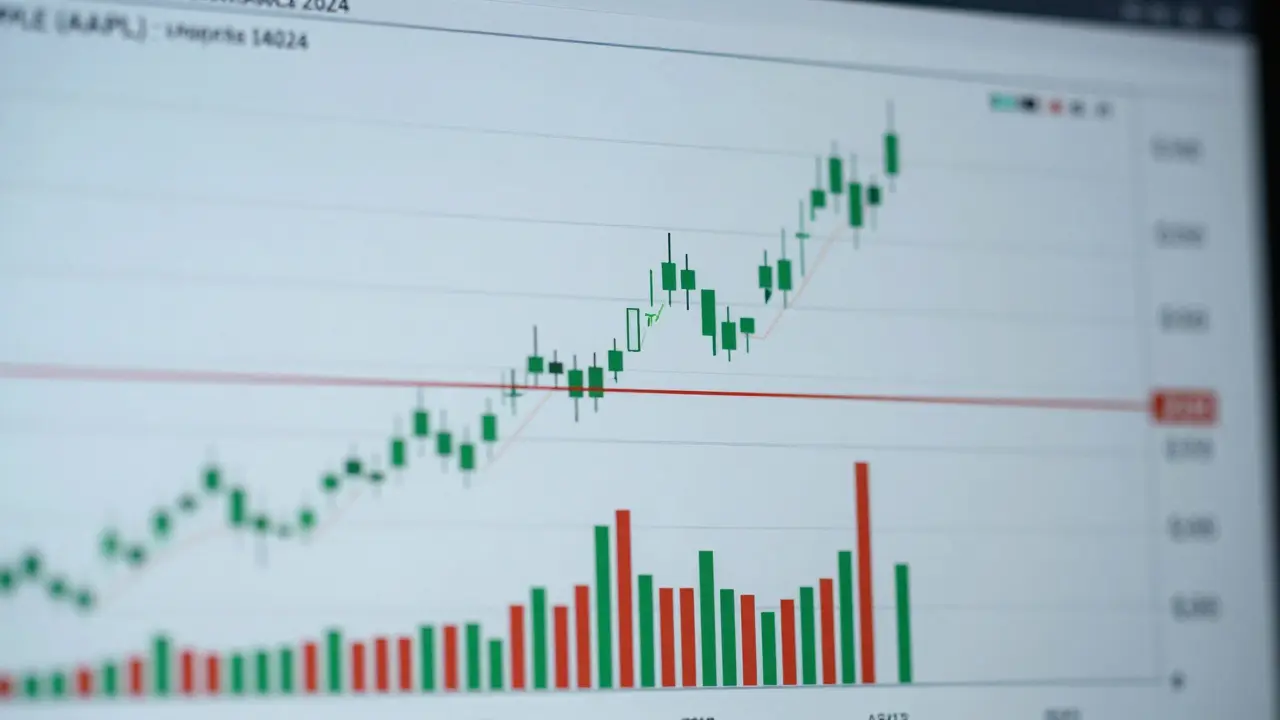
Learn how to decode stock market trends using price action, volume, and support/resistance levels-no indicators needed. Stop guessing and start reading what the market actually shows.
Read more
Stock Trading: How to Ride the Market Waves
- Lorcan Sterling
- 14 Comments
Learn how to ride market waves in stock trading by reading price action, using multiple timeframes, and sticking to clear entry and exit rules. No guesswork, just strategy.
Read more