Most people think market trends are something you feel in your gut or read about in headlines. But if you’ve ever bought a stock because it was "going up" and then watched it drop the next day, you know that feeling doesn’t work. Real market trends aren’t about luck or noise-they’re patterns hidden in price movements, volume, and time. Decoding them isn’t magic. It’s a skill built on observation, discipline, and a few proven tools.
What Market Trends Actually Look Like
A trend isn’t just a stock going up or down. It’s a consistent direction in price over time, supported by buyer or seller momentum. There are three basic types: uptrends, downtrends, and sideways trends. An uptrend shows higher highs and higher lows. A downtrend shows lower highs and lower lows. Sideways means price is stuck in a range, with no clear direction.
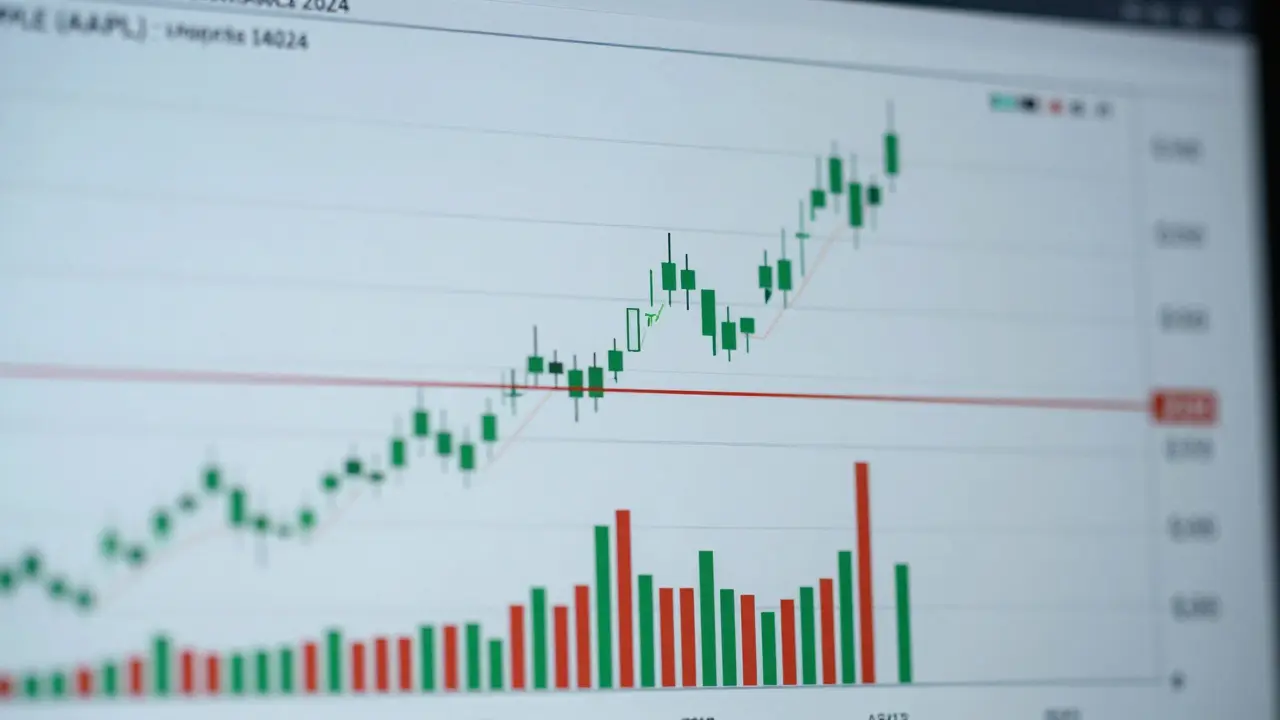
Look at Apple (AAPL) in late 2024. After hitting $220 in September, it didn’t just bounce around. Each pullback stopped above $210, and each rally pushed past the last peak. That’s an uptrend-not because analysts said so, but because the price action confirmed it. The same goes for Tesla in early 2025. After peaking at $280, it started making lower highs and lower lows. That’s a downtrend, plain and simple.
What most traders miss is that trends don’t need big moves to be real. A stock can trend up 2% a week for months and still be a strong trend. You don’t need 10% swings. You need consistency.
Price Action: The Language of the Market
Forget indicators for a second. The raw price chart is the most honest source of information. Price action is what happens when buyers and sellers meet-every candlestick, every gap, every breakout. Learn to read it.
For example, if a stock rallies hard on high volume, then pulls back on low volume, that’s a sign of strength. Buyers are still in control. But if it rallies on low volume and drops hard on high volume, that’s a warning. Sellers are stepping in.
Look for confirmation patterns:
- Two consecutive green candles closing near their highs after a pullback? That’s a potential trend continuation signal.
- A long wick on a red candle after a big rally? That means buyers tried to push up but got rejected. Could be a reversal.
- Three days of shrinking candles in a row during an uptrend? Momentum is fading.
These aren’t guesses. They’re repeatable observations backed by decades of trading data. You don’t need to know what RSI or MACD is to spot them. You just need to look at the chart and ask: Who’s in control right now?
Support and Resistance: The Invisible Walls
Every stock has invisible price levels where buying or selling kicks in. These are support and resistance zones. Support is where buyers step in to stop a drop. Resistance is where sellers step in to stop a rise.
Find them by looking at past price behavior. What price did the stock bounce off three times in the last six months? That’s support. What price did it fail to break through twice? That’s resistance.
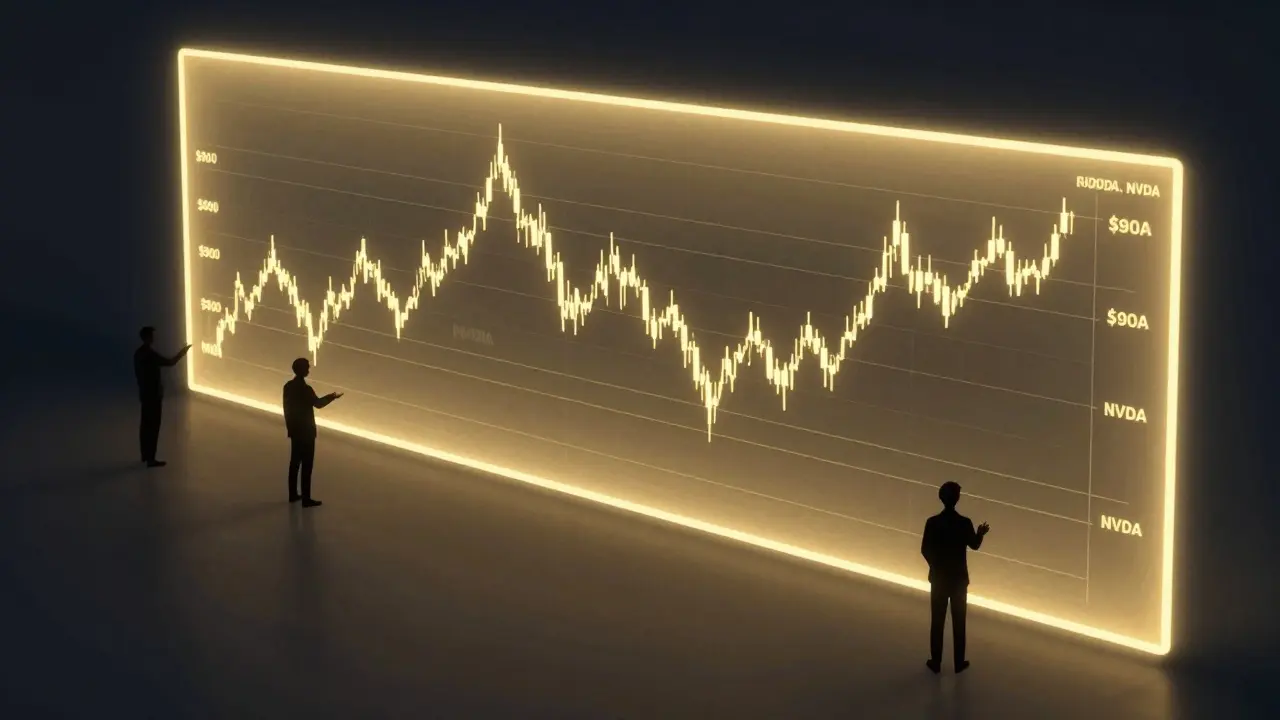
For example, NVIDIA (NVDA) hit $900 in November 2024, then dropped to $820, bounced back to $900, and dropped again to $830 before rallying past $900 in January 2025. That $900 level was resistance twice, then became support once it broke through. That’s a classic role reversal.
Trade with these levels. Don’t buy near resistance unless you’re betting on a breakout. Don’t short near support unless you’re betting on a breakdown. These aren’t magic numbers-they’re areas where thousands of traders have placed orders. The market remembers them.
Volume: The Hidden Confirmation
Price lies. Volume doesn’t.
A stock can spike up on fake news with low volume-and crash the next day. Or it can creep up slowly with steadily rising volume, and that’s the real deal. Volume tells you if the move has real buyers behind it.
Here’s how to use it:
- If price rises on volume higher than the 20-day average, the trend is likely strong.
- If price falls on volume above average, sellers are serious.
- If price moves sideways but volume picks up, big players may be accumulating or distributing.
Look at the chart of Meta (META) in December 2024. It rose 8% in one day-but volume was 30% below average. The next day, it dropped 5%. No real buyers. Just speculation. Now compare that to when it broke $400 in January 2025: 40% above average volume, three straight days of gains. That’s a real trend.
Volume turns price signals from guesses into evidence.
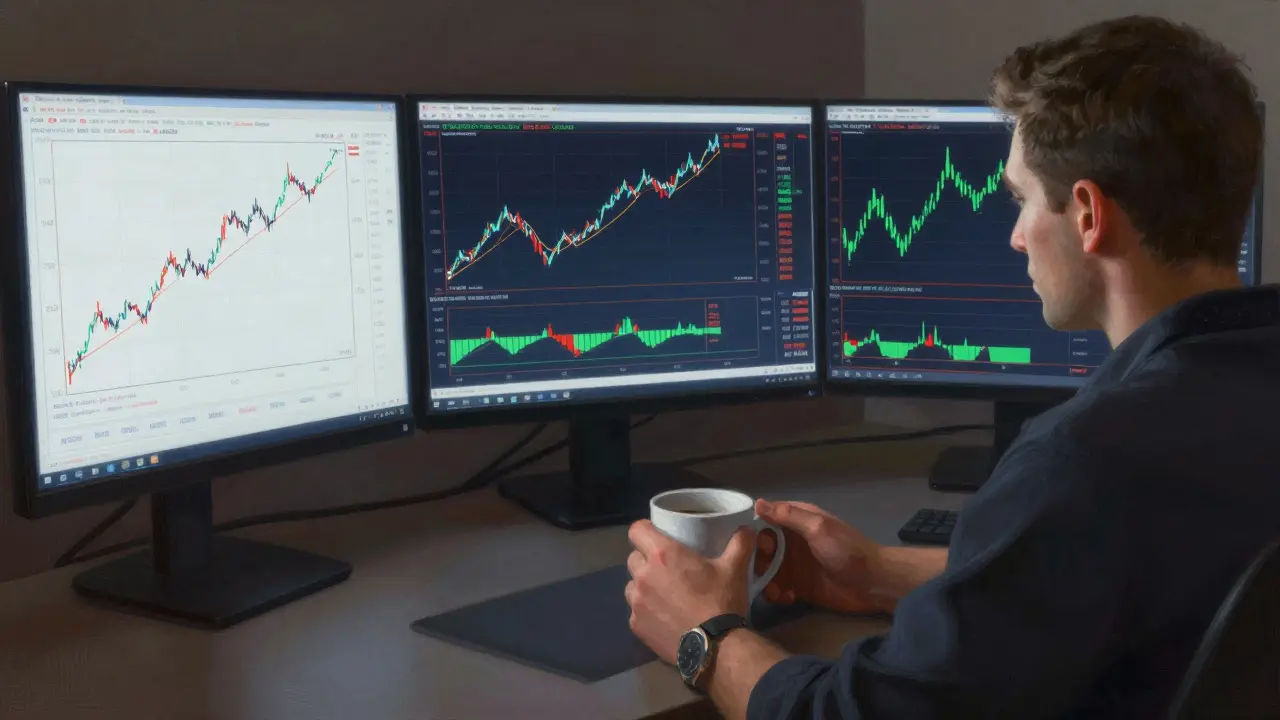
Timeframes Matter: What You See Depends on When You Look
A 5-minute chart will show you noise. A daily chart will show you trends. A weekly chart will show you the big picture.
Most beginners get trapped trading on 15-minute charts. They see tiny swings, chase every bounce, and lose money because they’re fighting the tide. The market’s main trend moves on daily and weekly timeframes.
Here’s a simple rule: Use the weekly chart to find the trend. Use the daily chart to find entry points. Use the 4-hour or 1-hour chart to time your trade.
For example, if the weekly chart of Amazon (AMZN) shows a clear uptrend since October, you’re not looking to short it on a 1-day dip. You’re looking for a pullback to $180 (a previous support level) to buy. That’s trading with the trend, not against it.
Think of it like driving. You don’t steer based on the bumper of the car in front of you. You look ahead. The same goes for trading.
Common Mistakes That Break Traders
You can know all the patterns and still lose if you make these three mistakes:
- Chasing trends after they’ve already run. If a stock has gone up 50% in three weeks, it’s not a bargain. It’s overextended. Wait for a pullback. The best entries come after a healthy retracement.
- Ignoring context. A breakout on a small stock with low volume means nothing. A breakout on Apple with record volume? That’s different. Always ask: Is this move supported by volume? Is it happening in a strong market? Is the sector helping or hurting?
- Trading without a plan. If you don’t know your exit before you enter, you’re gambling. Set your stop-loss and target before clicking buy. No exceptions.
One trader I know lost $12,000 in three months because he bought every breakout on Robinhood without checking volume or support levels. He thought he was "catching the wave." He was just riding the wave into the rocks.
Putting It All Together: A Real-World Example
Let’s say you’re watching Microsoft (MSFT) in January 2025. Here’s how you’d decode the trend:
- Weekly chart: Uptrend since September. Higher highs, higher lows. No signs of reversal.
- Daily chart: Price pulled back to $435 after a 12% run. That’s near the 50-day moving average-a classic support zone.
- Price action: Three days of small red candles, then a strong green candle closing above $440 with 2x average volume.
- Context: Tech sector is strong. AI earnings reports are positive. Competitors are lagging.
That’s a high-probability setup. You don’t need a fancy indicator. You just need to connect the dots: trend confirmed, support held, volume confirmed, context favorable. You enter near $440. You set a stop at $425. You target $475. You wait.
That’s how you decode a trend-not by predicting the future, but by reading what the market is telling you right now.
Start Small, Stay Consistent
You don’t need to master everything at once. Pick one stock. Watch its daily chart for two weeks. Note the support and resistance levels. Watch how volume changes with price. See if you can spot the pattern before the move happens.
Most traders fail because they want to win big fast. The real edge comes from small, consistent wins. One good setup a week, with discipline, beats ten reckless trades.
Market trends aren’t secrets. They’re signals. And if you learn to read them, you stop guessing. You start knowing.
Rubina Jadhav
January 22, 2026 AT 14:38This made me actually look at my charts differently.
Shivani Vaidya
January 23, 2026 AT 17:43The distinction between noise and genuine trend is something I wish more retail traders understood. The market doesn't care about your emotions or your favorite analyst's hot take. It only responds to consistent behavior in price and volume. When you strip away the noise, what remains is a language written in candlesticks and order flow. It's not complicated-it's just overlooked. Most people want a magic formula. There isn't one. There's only observation, patience, and the courage to wait for the right setup.
It's not about catching the top or bottom. It's about recognizing when the market is telling you it's safe to step in. That's the real skill. And it's learnable. Not through YouTube shorts or TikTok gurus, but through quiet, daily attention to the charts.
I've watched a single stock for six months just to see how it behaved around $150. When it finally broke through with volume, I didn't feel excitement-I felt calm. Because I knew what I was seeing. That's the difference between gambling and trading.
Discipline isn't sexy. But it's the only thing that keeps you alive in this game.
sumraa hussain
January 24, 2026 AT 14:36Broooooo I was literally just looking at NVDA last night and thinking-why the hell did it bounce at 820 AGAIN?? Now I get it!!! This is like reading the market’s diary, man!!!
Volume is the truth serum!!! Price is the liar!!! I’ve been fooled so many times by fake pumps!!! Now I check volume first-always!!!
Also, the part about ‘trends don’t need big moves’-YES!!! I used to think if it didn’t jump 10% in a day, it wasn’t worth it. Now I’m just chilling, watching 2% weekly climbs like a monk watching clouds. Peace.
Also, who wrote this?? I need to hug them.
Raji viji
January 24, 2026 AT 21:57LMAO you people think this is deep? I’ve been trading since 2018 and this is like reading a high school economics pamphlet. You didn’t mention Fibonacci extensions? You didn’t even touch on Wyckoff accumulation? You think volume is ‘hidden confirmation’? Nah, it’s the ONLY confirmation. And support/resistance? Please. Those aren’t ‘zones’-they’re psychological battlegrounds where institutional algos leave landmines.
You missed the entire context of macro liquidity. Without Fed policy, none of this matters. AAPL’s uptrend? Thank you, AI hype + QE. NVDA? Thank you, NVIDIA’s monopoly on H100s. You’re teaching people to fish while ignoring the ocean’s salinity.
Also, ‘set your stop before you enter’? That’s the bare minimum, buddy. You need position sizing, risk-reward ratios, and a kill switch for your ego. You’re giving people a spoon and calling it a survival kit.
Rajashree Iyer
January 25, 2026 AT 10:55The market is not a machine. It is a mirror. Every candlestick is a whisper of collective human fear and greed. We think we are trading stocks-but we are trading our own shadows.
When you see a breakout, what you are really seeing is the soul of the crowd rising-screaming, trembling, hoping. Volume? That is the heartbeat of a thousand unseen traders, holding their breath.
Support and resistance? These are not lines on a screen. They are sacred thresholds where memory becomes price. The market remembers every loss, every triumph, every tear shed over a red chart.
To trade is to become a monk in the temple of chaos. You do not conquer the trend. You surrender to it. And in surrender, you find clarity.
What is a trend, if not the echo of a thousand souls dancing in unison? We are not analysts. We are witnesses.
Parth Haz
January 26, 2026 AT 06:20Great breakdown. I especially appreciate how you emphasized consistency over big moves. Too many people chase fireworks and end up with ashes.
I’ve started applying this to my own portfolio-just one stock at a time. I’ve been watching TSLA’s daily chart for two weeks now. Noticed that every time it dips near $175, volume drops and the next day it bounces. That’s support. No indicator needed.
Also, the timeframe advice? Lifesaver. I used to jump around on 5-minute charts like a caffeinated squirrel. Now I check weekly first. It’s like switching from a magnifying glass to a telescope.
Small wins, daily discipline. That’s the path. Thanks for the clarity.
Vishal Bharadwaj
January 26, 2026 AT 20:18lol u think this is original? Every single point here is textbook stuff from 2015. And you call this 'decoding'? Nah. This is just candlestick 101. And you missed the whole point about order flow. Volume alone doesn't mean shit if you don't know where the bids are hiding. Also, 'support and resistance zones'? Please. Those are just lagging indicators dressed up like prophets.
And you didn't even mention the RSI divergence? Or the Ichimoku cloud? Or the fact that most of these 'patterns' fail 70% of the time in sideways markets?
Also, 'set your stop before you enter'? Bro, if you're still using fixed stops, you're playing checkers while the market is playing 4D chess. You need dynamic stops based on ATR. And stop hunting is real, you know? The algos know where retail puts their stops.
Also, 'don't chase trends'? Funny. That's what everyone says until the trend goes 300%. Then they say 'I missed it'. Hypocrites.
anoushka singh
January 27, 2026 AT 14:19Okay but like… why are we all pretending we’re Wall Street analysts? I just want to make a little extra cash so I can afford avocado toast. Do I really need to memorize candlestick patterns? Can’t I just buy ETFs and chill?
Also, I looked at MSFT and I still have no idea what’s going on. Is $440 high or low? Is volume good? I just know I’m confused and my brain hurts.
Can we just… not overcomplicate this? I’m not trying to be a trader. I just don’t want to lose my rent money.
Jitendra Singh
January 28, 2026 AT 16:22I’ve been testing this method on my small portfolio for the past month. Started with just one stock-Reliance. Watched the daily chart. Noticed support at ₹2,900. Waited for the volume surge on the breakout. Entered at ₹2,920. Stop at ₹2,850. Target ₹3,100.
Hit the target in 11 days. No stress. No panic. Just followed the map.
Didn’t need indicators. Didn’t need news. Just price, volume, and patience.
Still not rich. But I’m not losing either. That’s progress.
Thanks for the clarity. This is the kind of stuff that actually works.
Madhuri Pujari
January 29, 2026 AT 15:56Oh my GOD. Another ‘just look at the chart’ guru. Let me guess-you also believe in ‘the market is always right’ and ‘don’t fight the trend’ like it’s some sacred mantra? How quaint.
Let me tell you something: the only thing that’s ‘real’ is the order book. Not candlesticks. Not volume averages. Not ‘zones’. The only truth is the bid-ask spread and the hidden iceberg orders. Everything else is fairy tales for retail sheep.
You think AAPL’s uptrend was ‘confirmed’? Nah. It was manipulated by dark pools and algo sweeps. The ‘support’ at $210? That was a liquidity trap. The ‘volume surge’? Probably a wash trade.
And you’re teaching people to ‘wait for pullbacks’? Bro, the pullbacks are engineered. The algos know exactly where your stop-loss is. You’re not trading. You’re being harvested.
Stop romanticizing charts. The market isn’t a teacher. It’s a casino rigged by hedge funds with quantum computers.
And if you think this post is ‘deep’… you’re the reason I lose money every day.